A simple app that only does three things

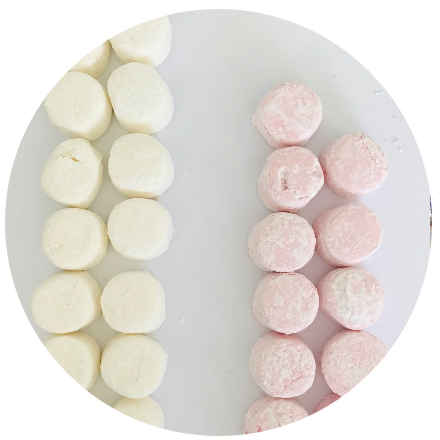
Here’s a scenario. You buy a jumbo bag of marshmallows that contains a mix of pink and white colours. Of the 120 in the bag, 51 are pink, which makes you unhappy because you prefer the taste of pink marshmallows.
Time to write a letter of complaint to the company manufacturing the marshmallows?

The thing we work so hard to get our statistics students to believe is that there’s this crazy little thing called chance, and it’s something we’d like them to consider for situations where random sampling (or something like that) is involved.
For example, let’s assume the manufacturing process overall puts equal proportions of pink and white marshmallows in each jumbo bag. This is not a perfect process, there will be variation, so we wouldn’t expect exactly half pink and half white for any one jumbo bag. But how much variation could we expect? We could get students to flip coins, with each flip representing a marshmallow, and heads representing white and tails representing pink. We then can collate the results for 120 marshmallows/flips – maybe the first time we get 55 pink – and discuss the need to do this process again to build up a collection of results. Often we move to a computer-based tool to get more results, faster. Then we compare what we observed – 51 pink – to what we have simulated.

Created using my learning.statistics-is-awesome.org/modelling-tool, yes it should be two-tailed, no my tool doesn’t allow this 🙁
I use these kind of activities with my students, but I wanted something more so I made a very simple app earlier this year. You can find it here: learning.statistics-is-awesome.org/threethings/. You can only do three things with it (in terms of user interactions) but in terms of learning, you can do way more than three things. Have a play!
In particular, you can show that models other than 50% (for the proportion of pink marshmallows) can also generate data (simulated proportions) consistent with the observed proportion. So, not being able to reject the model used for the test (50% pink) doesn’t mean the 50% model is the one true thing. There are others. Like I told my class – just because my husband and I are compatible (and I didn’t reject him), doesn’t mean I couldn’t find another husband similarly compatible.
Note: The app is in terms of percentages, because that aligns to our approach with NZ high school students when using and interpreting survey/poll results. However, I first use counts for any introductory activities before moving to percentages, as demonstrated with this marshmallow example. The app rounds percentages to the closest 1% to keep the focus on key concepts rather than focusing on (misleading) notions of precision. I didn’t design it to be a tool for conducting formal tests or constructing confidence intervals, more to support the reasoning that goes with those approaches.
