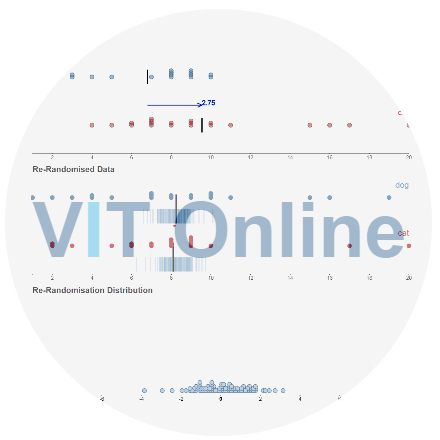
Visualising bootstrap confidence intervals and randomisation tests with VIT Online

Simulation-based inference is taught as part of the New Zealand curriculum for Statistics at school level, specifically the randomisation test and bootstrap confidence intervals. Some of the reasons for promoting and using simulation-based inference for testing and for constructing confidence intervals are that:
- students are working with data (rather than abstracting to theoretical sampling distributions)
- students can see the re-randomisation/re-sampling process as it happens
- the “numbers” that are used (e.g. tail proportion or limits for confidence interval) are linked to this process.
If we work with the output only, for example the final histogram/dot plot of re-sampled/bootstrap differences, in my opinion, we might as well just use a graphics calculator to get the values for the confidence interval 🙂
In our intro stats course, we use the suite of VIT (Visual Inference Tools) designed and developed by Chris Wild to construct bootstrap confidence intervals and perform randomisation tests. Below is an example of the randomisation test “in action” using VIT:

![]()
Last year, VIT was made available as a web-based app thanks to ongoing work by Ben Halsted! So, in this short post I’ll show how to use VIT Online with Google sheets – my two favourite tools for teaching simulation-based inference 🙂
1. Create a rectangular data set using a Google sheet. If you’re stuck for data, you can make a copy of this Google sheet which contains giraffe height estimates (see this Facebook post for context – read the comments!)
2. Under File –> Publish to web, choose the following settings (this will temporarily make your Google sheet “public” – just “unpublish” once you have the data in VIT Online)

Be careful to select “Sheet1” or whatever the sheet you have your data in, not “Entire document”. Then, select “Comma-separated values (.csv)” for the type of file. Directly below is the link to your published data which you need to copy for step 3.
3. Head to VIT online –> https://www.stat.auckland.ac.nz/~wild/VITonline/index.html. Choose “Randomisation test” and copy the link from step 2 into the first text box. Then press the “Data from URL” button.

4. At this point, your data is in VIT online, so you can go back and unpublish your Google sheet by going back to File –> Publish to web, and pressing the button that says “Stop publishing”.
The same steps work to get data from a Google spreadsheet into VIT online for the other modules (bootstrapping etc.).
[Actually, the steps are pretty similar for getting data from a Google spreadsheet into iNZight lite. Copy the published sheet link from step 2 in the appropriately named “paste/enter URL” text box under the File –> Import dataset menu option.]
In terms of how to use VIT online to conduct the randomisation test, I’ll leave you with some videos by Chris Wild to take a look at (scroll down). Before I do, just a couple of differences between the VIT Chris uses and VIT Online and a couple of hints for using VIT Online with students.
You will need to hold down ctrl to select more than one variable before pressing the “Analyse” button e.g. to select both the “Prompt” and “Height estimate in metres” variables in the giraffe data set.

Also, to define the statistic to be tested, in VIT Online you need to press the button that says “Precalculate Display” rather than “Record my choices” as shown in the videos.
Lastly, a really cool thing about VIT Online is that once you have copied over the URL for your published Google sheet, as long as you keep your Google sheet published, you can grab the URL from VIT Online to share with students e.g. https://www.stat.auckland.ac.nz/~wild/VITonline/randomisationTest/RVar.html?file=https://docs.google.com/spreadsheets/d/e/2PACX-1vTcaGSrAbGSntbrUoifNv8g048KJwEnBI–Rmmxqu1N0rb0VRUHoUkIeT-8xo3O9eqTUqZIML_EH523/pub?gid=0&single=true&output=csv&var=%20Prompt,c&var=Height%20estimate%20in%20metres,n. Sure, it’s not the nicest looking URL in the world, so use a URL shortener like bit.ly, goo.gl, tiny.cc etc. if sharing with students to type into their devices.
Note: VIT Online is not optimised to work on small screen devices, due to the nature of the visualisations. For example, it’s important that students can see all three panels at the same time during the process, and can see what is happening!
Now, here are those videos I promised 🙂
