Which one doesn’t belong …. for stats?

If you haven’t heard of the activity Which one doesn’t belong? (WODB), it involves showing students four “things” and asking them to describe/argue which one doesn’t belong. There are heaps of examples of Which one doesn’t belong? in action for math(s) on the web, Twitter, and even in a book. From what I’ve seen, for math(s) I think the activity is pretty cool. In terms of whether WODB works for stats, however, I’m not so sure. Perhaps for definitions, facts, static pieces of knowledge it could work (?), but in terms of making comparisons involving data and its various representations (including graphs/displays), I need more convincing. There’s something different between comparing properties of shapes (for example), which remain fixed, and comparing data about something/someone, which could vary.
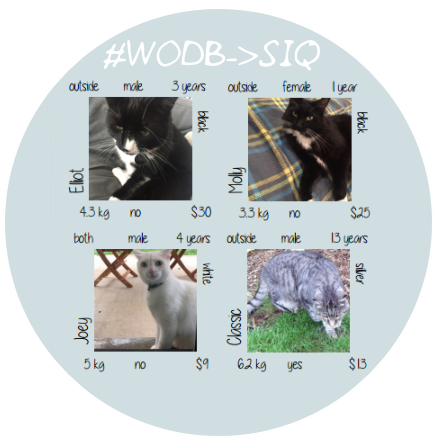
For example, What cat doesn’t belong? for the four “stats cats” data cards shown below.
 |
 |
 |
 |
To make comparisons between the four cats means to reason with data, but if I am considering only the data provided in these four data cards then these comparisons are made without uncertainty. For example, I can say definitively, for these four cats, that:
- Elliot is the only cat with a name that has three syllables,
- Molly is the only female cat,
- Joey is the only cat is both an inside and outside cat,
- Classic is the only cat that uses a cat door.
I could argue many different cases for which cat (or photo) does not belong. This is all cool, but doesn’t feel like statistics to me. Statistics is all about using data to make decisions in the face of uncertainty, by appreciating different sources of variation and considering how to deal with these. In particular, inferential reasoning involves going beyond the data at hand, thinking about generalisability, considering the quality and quantity of data available, and appreciating/communicating the possibility of being wrong not matter how “right” the methodology.
So while I appreciate that WODB allows for “not just one correct answer” and the development of argumentation skills, I’d be more happier if this kind of activity within statistics teaching led to the posing of statistical investigative questions (SIQ): WODB->SIQ. Why? We need more data and more of an idea of where the data came from to really answer the really interesting questions that comparing these four cats might provoke us to consider. We need students to feel the uncertainty that comes from thinking and reasoning statistically and to help students find ways to deal with this uncertainty. We also need students to care about the questions being asked of the data – my worry here is that otherwise the question students might ask when using WODB is Who cares which one doesn’t belong? 🙂
Questions I have when looking at these stats cats data cards, which are interesting to me are: I wonder …. How many syllables do cats’ names have? Do most cats have two syllable names? Is Elliot (my cat!) an unusual name for this reason? Do I spend too much on cat food ($NZD30 per week)? Or maybe black cats are more expensive to feed? I won’t be able to get definitive answers to these questions, but by collecting more data and investigating these questions using statistical methods I can get a better understanding of what could be plausible answers.
PS Want some of these data cards? Head here –> It’s raining cats and dogs (hopefully)
