Using awesome contexts … and questions!

The New Zealand Income Survey SURF data set from Statistics New Zealand is a great resource (as are the many other awesome things available from Statistics New Zealand). I used this context and data set initially with a group of Year 13 students who had come through our “applied” pathway (see an earlier post on how we got students to write first before looking more specifically at the variables). The questions that we ask are as important as the context that we use for an investigation. I know many of us have developed generic questions we ask students for each stage of the inquiry cycle, but have you modelled asking these questions in context? When working with this particular group of students I found it really effective to ask “feature spotting” questions in context so that students could see what writing specifically about data looked like, and then had guidance to write their answer (basically to recycle the words used in the question in their answer). This approach for students took away some of the initial barriers to getting into writing. Using contextualised questions also gives the opportunity to model deeper thinking for that specific context and set of data. We want students to see how the chain of questions we follow changes depending on what we see and explore in the data and we need to model this for different contexts and data. |

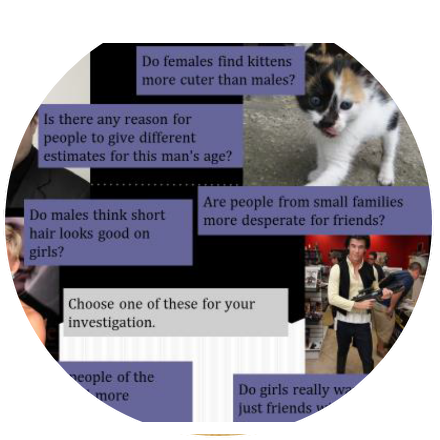
This example of a wide range of questions used to start investigations is not just about using funny hooks to engage students but also comes from questions the students themselves were interested in finding out answers to – why not ask your students what they would like to investigate? I would also encourage as much as possible to get students simultaneously investigating different variables and situations rather than the whole class doing the same thing. At the heart of learning about statistics is to recognise “What is staying the same(ish)?” and “What is changing?”, and this can be strengthened when four students working beside each other investigating completely different questions/data can compare what was similar and different about their investigations.. There also something about students getting to choose what they want to investigate in terms of ownership and buy-in. The data used to explore these questions came from a “Ratings survey” which we developed and got students from our school to complete. |

Going further with the idea of using survey to get data and set up a context that students will find interesting, we also used this “Super survey” with all our senior students at the school to get reasonable sized population data set from which we could then sample (if you are uncomfortable about this practice, read more in the post “Using awesome real data …“). There are so many ways that this data can be used and it gives a fresh take on the data students are familiar with from the awesome Census at School. Two of these questions were inspired by Neville Davies (the ones based on the distance from home to school) and the plenary he gave at the 2013 AMA Statistics Teacher’s Day. We used Google forms to set up the survey and many of the questions require students to use various web-based resources to get answers. The survey itself would not necessarily pass a questionnaire design assessment as it really was a jumble of questions but it did give us a really rich data set to explore with students. |

A few other things that we did to make sure the students had a good connection to the context, variables and so the data was to ask them to review each question used in the super survey by classifying the variables as categorical or numerical (with the possible groups and likely numerical values) and also considering how the variable was measured. This stuff is important for all investigations even if the focus is on one aspect of the curriculum (e.g. sample-to-population inference). I also selected some of the numerical variables and some of the categorical variables and |
This post is based on a plenary I did for the Christchurch Mathematical Association (CMA) Statistics Day in November 2015 where I presented 10 ways to embrace the awesomeness that is our statistics curriculum. You can find all the posts related to this plenary in one place here as they are written.

