
Spot the errors – final draft
In NZ, it's report comment writing time for teachers, which means for many statistics teachers not just the fun of writing reports but also the not-so-fun job of checking other teachers' comments for errors (I'm looking at you English department!) One of things we used to do every year as part of "report comment writing PD" was to look at different examples of report comments and identify as many errors as possible.
So in line with this kind of activity, for this post I've put together some examples of tasks and/or student responses that demonstrate some common misunderstandings for statistics, each followed by discussion partially informed by comments other teachers made on the earlier version of this post. Use the tabs at the left hand side of this post to move through each part.
For each of the examples:
- Have a read of the task/student response
- Identify the different misunderstandings demonstrated in the task/student response.
- Try to prioritise the misunderstandings to decide on the ONE that is the most serious and needs addressing first.
Task
The Coach of a soccer team ran a new training programme over the season. At the start of the season and at the end of the season the players in the soccer team had to complete different tests for their ball handling skills. One test was for how many times in a row each player could bounce a soccer ball on their head. You have been given the bounce data in the table below. Write a short report for the Coach of the soccer team about the effectiveness of their training programme.

Student report
Sorry Coach, but the new training programme did not improve each player’s ability to bounce balls on their head, as you can see in my graphs below. The median number of times in a row a ball is bounced on a head was 9 at the start of the season and 9 at the end of the season, so the players did not improve with this skill. The box for the end of the season is not shifted far enough to the right as the median of the end of season is not outside the box of the start of season. So you can't make a call that the numbers of times in a row a ball is bounced tends to be higher at the end of the season compared to the start of the season. There is no difference in how they performed in this ball handling skills test between the start of the season and the end of the season.

As part of a presentation last year, I tried to summarise what I think is important to consider when faced with anything requiring statistical thinking: What are our awesome messages?

I'm going to use these three principles for some of the discussion sections of this post:
- It matters how much data you have and how you got that data
- It matters what you are measuring and how you are measuring it
- It matters that you are uncertain and that there is variation
When I initially published this post, I asked for teachers to submit anonymously what they thought was the biggest misunderstanding demonstrated by the example (the task or the student response). After a few days, I shared these comments unedited on this site so that teachers would be able to view and compare what had been written. This was motivated by a desire to demonstrate that we don't all see the same things in student writing or tasks and also to show the range of possible issues with the task or student response.
So what did teachers identify as the biggest misunderstandings?
- That the nature of the data lends itself to a paired comparison, not a comparison of two independent groups
- That the nature of the study was about an experiment and suggestive causality, not a sampling situation
- That the student incorrectly applied sampling-to-population inference methods associated with box plots
- That the design of the experiment was flawed as there was no random allocation or control groups used
- That the words "no difference" were used rather than "I can't make a call" or "I can't tell"
- That the student has made statements based on point estimates such as the medians without looking at the shape and variation of the data
These are all good points, and it is a difficult to identify which one is the most serious or has the highest priority to address with a student. That there are a number of issues with what was written by the student highlights why it is so important that we always consider how we are building on and building up the key ideas that underpin statistical thinking. For the remainder of this discussion, I have given examples of the kinds of questions I would want to ask students and the kind of thinking I would like students to demonstrate when considering how to write their response to this task.
It matters how much data you have and how you got this data
Why does it matter that this data was collected from a single soccer team over one season? Why does it matter that the data was not obtained through a random sampling method? Why does it matter that the design is of an experimental nature as there was an intervention, however, there was no control group for comparison and no controlling of related variables?
Desired student thinking: I can explore this data to uncover what it might suggest about the effectiveness of the training programme, but any suggestive inferences would be limited to this team only and would be weakened by the fact that the players may get better/worse over the season for other reasons. That is, I can not say that the training programme was the only reason that the players improved/worsened with their ball handling skills. I also could not say that the training programme would work for other players in other soccer teams.
It matters what you are measuring and how you are measuring it
Why does it matter that only one of the tests for ball handling skills was used in the analysis? Why does it matter that each player was measured twice - once at the beginning of the season and again at the end of the season? Why does it matter that the response variable is a numerical variable?
Desired student thinking: I need to consider whether bouncing a ball on your head is a good/best measure of ball handling skills, and should really explore the data from the other tests to assess the performance of the players. I need to measure the change in performance for each player by taking the the difference of their two test results, this is because the players would have different starting skills and what I want to know is if the training programme improved their performance from this starting point. Since the test data is numerical, I can use a dot plot and box plot to display the differences. [I could also used a link graph, two dot plots which show clearly how the test results are linked for each player between the before and after].
It matters that you are uncertain and there is variation
Why does it matter that each player has a different ability? Why does it matter that that you are using a summary measure like the mean or median? Why does it matter that you refer to statistics calculated from experimental data as estimates?
Desired student thinking: I need to think about the different sources of variation and how they could affect the data I am using. There is natural variation because each player is different has a different ability for the task, and when I use a summary statistic like a mean this I am trying to capture an overall measure of ability, based on the average, for all the players. But a summary measure like the mean won't capture how different each player is from each other in terms of ability. I need to be clearly communicate that I am uncertain and don't know the true value and that is why I will use the word estimate.
Student report
My investigative question was "I wonder if boys who ran the Auckland kids marathon in 2015 are faster than the girls who ran the same event?" My graphs of the times for the boys and girls who ran the Auckland kids marathon in 2015 are shown below:
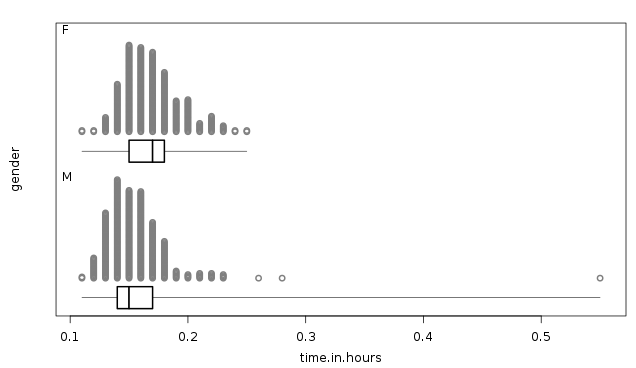
The shapes of the distribution of times to run the event are pretty similar, in that they are both positively skewed. The boxes are pretty similar in size as well. But anyway, the main thing is I can't make a call that the boys ran the Auckland kids marathon faster than the girls in 2015, because the boxes for both groups overlap, and the median time for the boys to run the event is inside the box (the middle 50% of times) for the girls to run the event. So the times are too similar - there's no difference between how fast the boys and girls were. Plus the three slowest times were the boys, including one who took ages to run the event!
So what did teachers identify as the biggest misunderstandings?
- That you have been given population data, so you can identify who ran faster on average (boys), you don't need to make an inference from a sample to a population
- That even if you considered this sample data, the sample size is huge and so you can make a call with a smaller shift between the two samples
- That even if the two samples are similar, you can't say there is no difference, even if it is too close to make a call
- That the student does not understand their investigative question, or that their investigative question is incorrect
It is important that we have a clear idea/understanding of whether we are working with sample data or population data, or in other words, whether we are wanting students to engage with inferential reasoning (going beyond the data in front of them) or exploratory data analysis (specifically describing the data in front of them).
At higher levels we tend to be a bit more flexible and loose with the idea of a sample but with younger students it is important to keep things simple and clear. If this set of data did represent a sample from a population, what would that population be? At secondary school level, this should be easy to define, not tricky or messy.
Reviewing student responses is a common feature of good PLD. The goal is to understand more about what misunderstandings students have, so we can be aware of this when teaching and to check for these misunderstandings when using formative assessment. Coupled with his should be to review what statistics education research related to the misunderstanding has uncovered.
When I first posted these examples, I asked for teachers to anonymously submit their thoughts on what they thought was the BIGGEST misunderstanding. I was interested to how similar the responses would be - would we all see the same big issue?
I think one of the cool things about doing an activity like this is that we can assume that everyone sees the same thing we do when reading an assessment task or student work. Sometimes in group discussion you don’t get to hear these different perspectives because someone else says the “right” thing first.
So one way to use these activities as part of any PLD might be to use a similar approach. Ask teachers to choose what they think is the biggest problem and to submit this anonymously through an app like Socrative. Then share all the comments, compare them and discuss the similarities and differences in perspective.