Getting the awesome messages heard …


Learning about statistics is awesome – it helps you to make sense of the world and it helps you to make good decisions when faced with uncertainty. It shouldn’t be that difficult to get these kinds of messages across to teenagers since they are so important. But then think about what decisions teenagers actually get to make about their lives – how do we give them something where they will care about the decision being made? Teenagers do need to make decisions about things like alcohol, drugs, driving, study, sports, relationships etc., many of which we can use as contexts within a classroom learning environment, although some finer details we would definitely avoid! There is also a very strong case to use contexts to encourage students to think about more than just themselves and to think about the world and wider social and economic issues and how decisions made by others could affect their lives now and in the future. There are great examples of how statistics has been used to make important discoveries and we should share these with students. But there is also a good case to play to your audience (egocentric teenagers) and make it about them right here and now 🙂 |

Teenagers hate things that are unfair. For example, telling them to stop talking when clearly there are other students in the class talking! I think that sometimes students don’t care about whether they can make a call or not when engaging with sample-to-population inference because they don’t care about getting it wrong (or right). Why should teenagers care if the median height of boys at their school is higher than the median height of girls at their school? We, of course, want them to care about the statistical understanding required to know how to answer that question. Something we tried last year was to begin the unit of work on inference with a scenario where a Principal had made a decision that “unfairly” affected just one group of students: Year 12 students not getting to wear mufti. Note we asked students to discuss the scenario in groups and give one reason for and one reason against the decision. It is important to ask students why they think the decision could be justified so you can uncover misunderstandings as well as understandings (more about this is a related post later). What we wanted was for students to tell us that you can’t make a call based on the medians alone but they (in particular the Year 12 students) came back with other reasons, including challenging the variable being used (e.g. shouldn’t it be results in the exam?) A funny thing about using this scenario was that a few weeks later during an assembly our Principal did announce a special Year 13 only mufti day. My Year 12 students were convinced this was all my fault! |
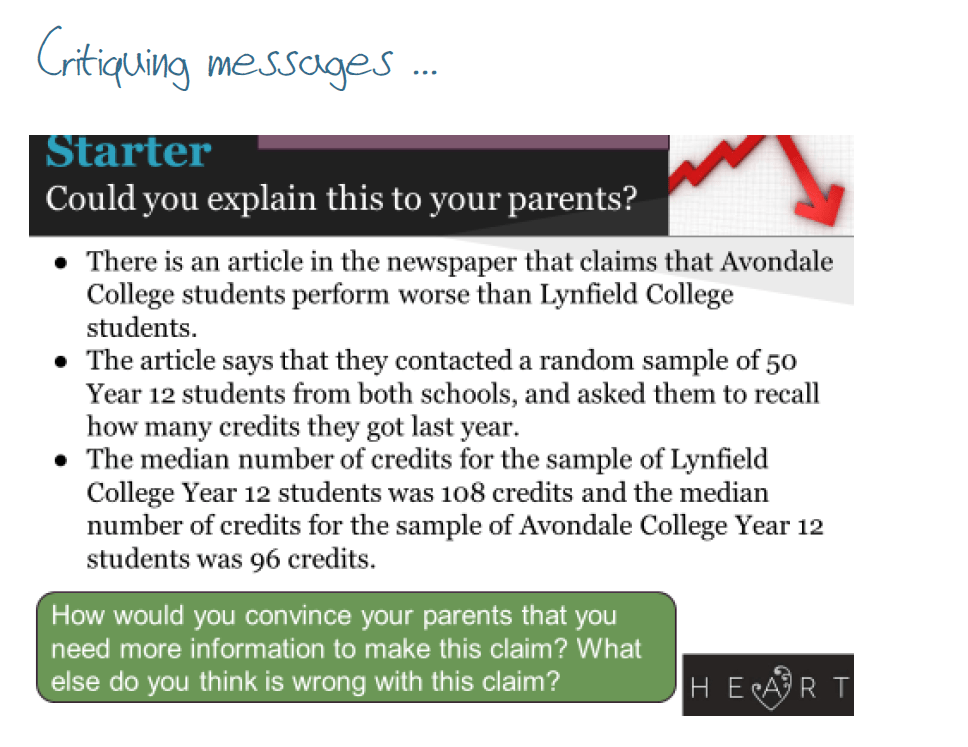
So we want students to challenge the messages given to them, but not just out of self-interest (like the previous example) but also from a statistical point of view. We also want students to be able to explain to others (e.g. their parents) why some messages given in the media need to be challenged and so share these important messages about how to use statistics to make decisions. It is important for students to consider specific contextual reasons or explanations for differences BUT it also important that they can use general statistical ideas to discuss weaknesses in decision making. With this scenario, similar to the previous scenario, students were keen to give explanations focusing on personal contextual reasons or “stories” but did not immediately respond with challenges based on the need to take into account sampling variability. Yes, there are lots of ways in which the two schools are different, and there are potential issues with how the data was collected and what variable was used to measure performance, as well as generalisability issues (using Year 12 students credits to generalise about all students at each school), but …. |

…. we also want students to imagine the sample data not provided in the article and think about this in terms of the key message about using samples to make inferences about populations – we can’t make good calls based on the sample statistics alone without taken into account sampling variability. |
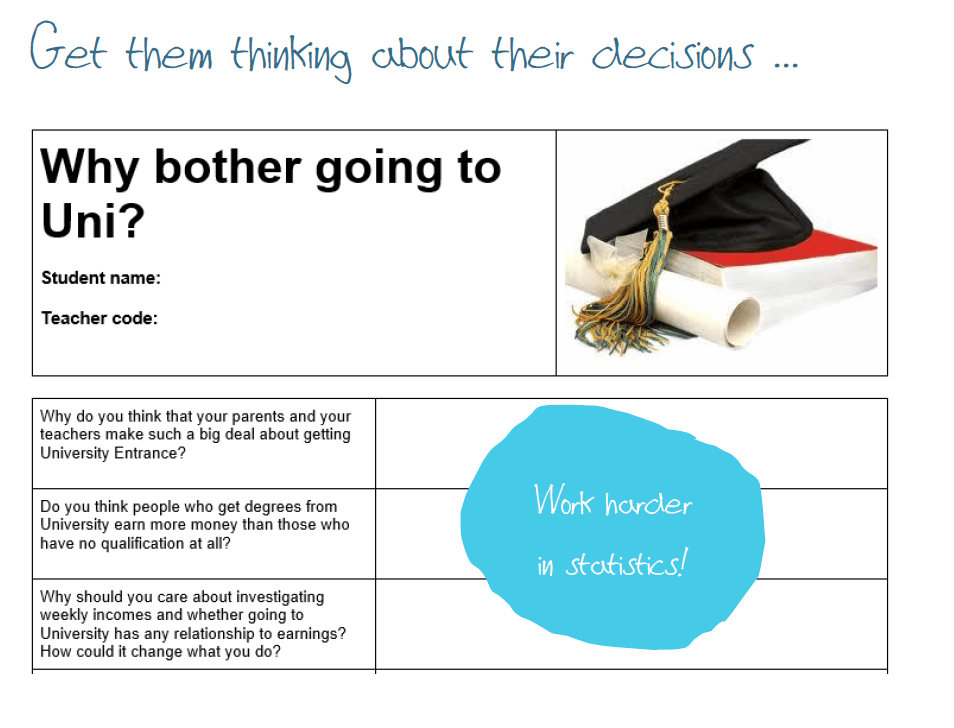
The New Zealand Income Survey SURF data set from Statistics New Zealand is a great resource (as are the many other awesome things available from Statistics New Zealand). I used this context and data set initially with a group of Year 13 students who had come through our “applied” pathway (more about this in the next related post). The idea is to get students writing initially for an investigation about what they thought about the issue and how it affects them personally. It was all part of an attempt to get students to “buy in” to the investigation so they would care about what they found out. It was also to get them writing straight away without needing to know anything statistical, to avoid turning students off at the beginning of the investigation – everyone can write about what they think and feel about something! And of course, using something where you can link going to uni with possibly earning more money can be used to encourage them to do well in their University Entrance subjects 🙂 |
This post is based on a plenary I did for the Christchurch Mathematical Association (CMA) Statistics Day in November 2015 where I presented 10 ways to embrace the awesomeness that is our statistics curriculum. You can find all the posts related to this plenary in one place here as they are written.