Not so awesome interpretations …

Being able to communicate an interpretation of a confidence interval is important. The reason why we care so much about students writing good investigative questions is so that when they come to answer these questions as a result of their exploration and analysis of the data, they are clear about what they were trying to find out and who they were trying to find it out about (in the case of sample-to-population inference). I will discuss in a later post (“Believing assessment is awesome”) more about using the written interpretation only as a measure of understanding of confidence intervals. What I am focusing on in this post is how we need to encourage students to go beyond the words or the procedure of writing the interpretation of the confidence intervals and to think about what they are really saying. |

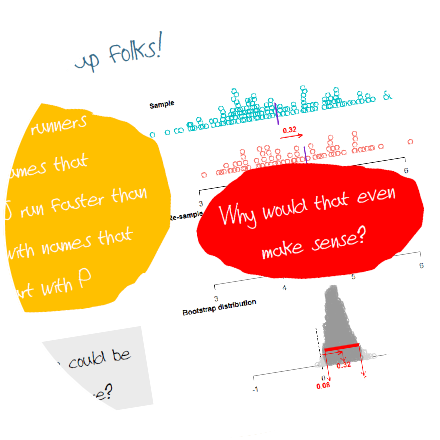
So, it appears that Auckland runners with names that start with J run faster on average than those with names that start with P. But why would that even make sense? It is common practice to encourage students to write about their expectations for an investigation at the beginning of the process and then to reflect on the findings in respect to their expectations. In this situation, given students know about the differences between males and females in terms of physical performance, students may be able to consider that perhaps there is something else going on here…. |

…. which could be that names that start with J may be dominated by male names and names that start with P may be dominated by female names. We need to be careful that in focusing on the investigative question variables and the necessary interpretation of the confidence interval that we do not forget that we are dealing with multivariate data. When we observe a tendency for one group to be higher than another group in these sampling situations we need to be careful that we also discuss and dispel implications of causality. An effective way to minimise ideas of causality is to show students other groups to compare the numerical variable on, like we have here (letter of first name, gender). If we don’t demonstrate these other relationships and just say “don’t make a casual claim” it may be hard for the students to really understand why we need to be careful with causal attribution. |

Returning to the practice of getting students to reflect on whether the findings of their investigation make sense – which is a great thing to get students to do! However, we need to be careful here that we don’t promote causal attribution unintentionally. In this example, two different students investigated intelligence self-ratings, with one student comparing whether someone was in a sports team or not, and the other comparing gender. Both students can “make a call” and both students can align this result with what they think is going on (see the slide above for examples). But it is important with “sense making” that we don’t encourage students to consider this as evidence of a causal link – just because something makes sense to you doesn’t mean that it is true. Ideally, you would want these two students to look at each other’s results and discuss what they both found – including looking at the relationship between sports team and gender (two categorical variables). |
This post is based on a plenary I did for the Christchurch Mathematical Association (CMA) Statistics Day in November 2015 where I presented 10 ways to embrace the awesomeness that is our statistics curriculum. You can find all the posts related to this plenary in one place here as they are written.

