This year I decided to use a new context to introduce my students to exploratory data analysis – LEGO.

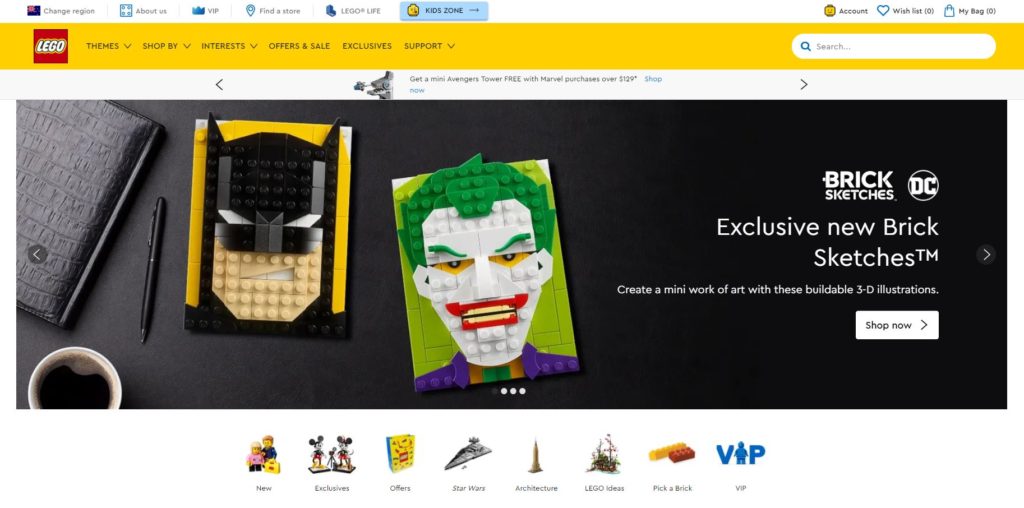
I scraped data from LEGO.com to get a rectangular data set containing all the LEGO sets currently for sale on the website. I introduced this to a brand new class of students in their first lecture with me and I asked them first to go on to the website and think about the following things:
- What information could be collected?
- What variables (factors) might we be able to get data on?
- How might the data be organised?
- What do you want to find out?
- What questions do you have?
I didn’t realise it at the time, but this initial exploration of the website paid off in a big way throughout the next few lectures. Students had a chance to really see where the data came from and what it was about, they could connect the variables to something they could see on the website, they got to think about what they might want to investigate and by flicking through several of the sets they built up an intuition (which may turn out to be wrong) about what they might find. On top of that LEGO was a great leveller – every student in my class had played with LEGO!
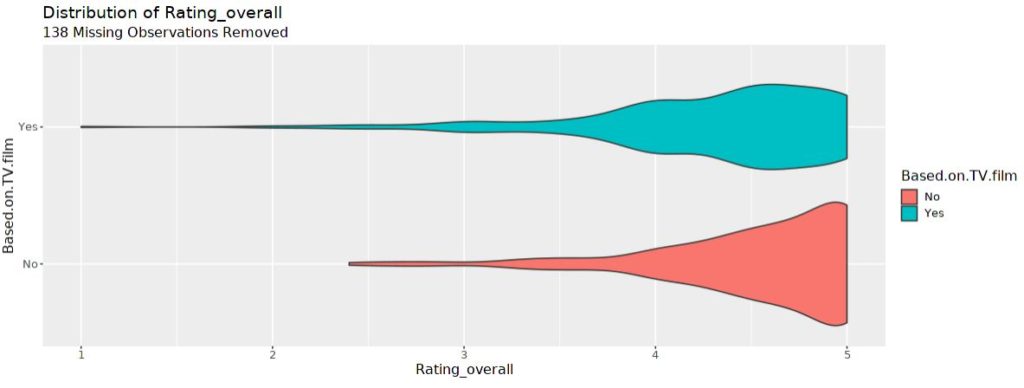
I got the students to feed back to me what variables they thought might appear in the dataset. I got some of the more obvious things like price and number of pieces but they also suggested some things that were more novel. We discussed why some of those factors could or couldn’t be measured (e.g. awesomeness) or how some of them we would have to code ourselves after scraping the data from the website (e.g. based on Film/TV). We discussed some issues with the data, such as how some sets didn’t have any ratings but others did. The students had some fantastic ideas.
Then we launched into exploring the data. We began with price and first I had the students look through LEGO.com and make an estimate of what they thought the average price was for a LEGO set. This was really interesting as some students got quite close but others had estimates that were too high because the sets they chose to look at were more high end. We then opened up the data in iNZight and created a dotplot of price and continued to explore from there. Over the next few lectures we created all kinds of plots and explored all kinds of variables.

I really enjoyed using a data context that was easy for every student to relate to and that got so many of them interested and excited. It created a low floor entry point as every student could look at the website and explore, plus there was a high ceiling as some students got creative with what they wanted to investigate.
My student evaluations at the end of the semester were peppered with comments about how great it was having LEGO as a theme but even without those, they had fun and I had fun and that’s what learning is supposed to be.

Emma is a Professional Teaching Fellow in the Department of Statistics, University of Auckland.