When I made the move to online teaching earlier this year because of COVID-19, one of the only things I was actually prepared for was including interactivity in my online synchronous lectures (AKA “live lectures”). Teaching 300+ students intro stats students in face-to-face lectures meant that I had already developed strategies to connect with students in a large space with large physical distances between me and my students. To engage students I’ve been developing a bunch of Google sheet-based apps, which I’ll talk about how to create in my next post on this blog.
The activity I’ll focus on in this post is somewhat of a “classic” lesson: you know the one where you compare non-random sampling vs random sampling to demonstrate bias. Existing activities include the “Eighty circles” activity in the GAISE report PRE-K-12 (Figure 22, p. 53) and the “Gettysburg Address” activity from Beth Chance and Allan Rossman’s textbook Investigating Statistical Concepts, Applications, and Methods (pp. 172-189). STATS MEDIC (Luke Wilcox and Lindsey Gallas) have developed a very cool version of this activity which involves sampling words from song lyrics to explore the question Does Beyoncé Write Her Own Lyrics?
My “online” version also uses song lyrics/word length as the context for sampling, using whatever song I like from the Top 40 charts the week I teach this activity! After telling students they need to select five words from the lyrics, I share the link to the app with them during the “live lecture”. Give the app a go below – take a “carefully selected” sample of five words (pretend like you don’t know how this activity goes!)
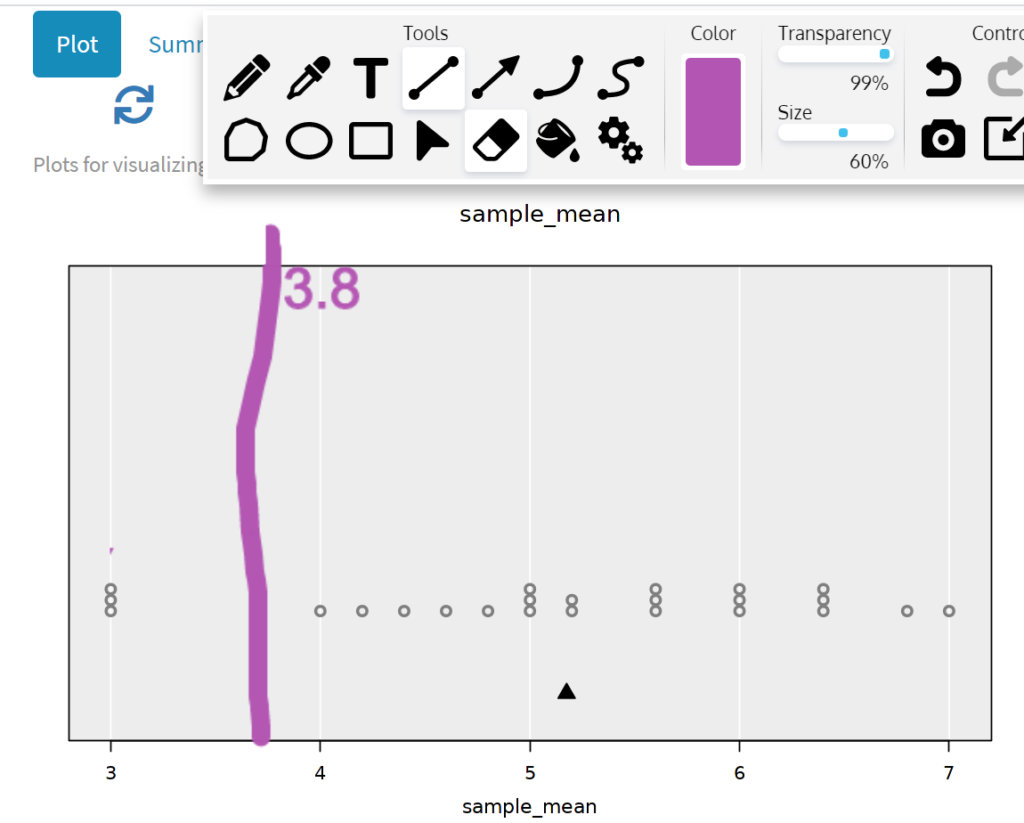
Because the app is linked to a Google sheet, as soon as my students complete the task, I have access to their sample means and can show them how well they did.

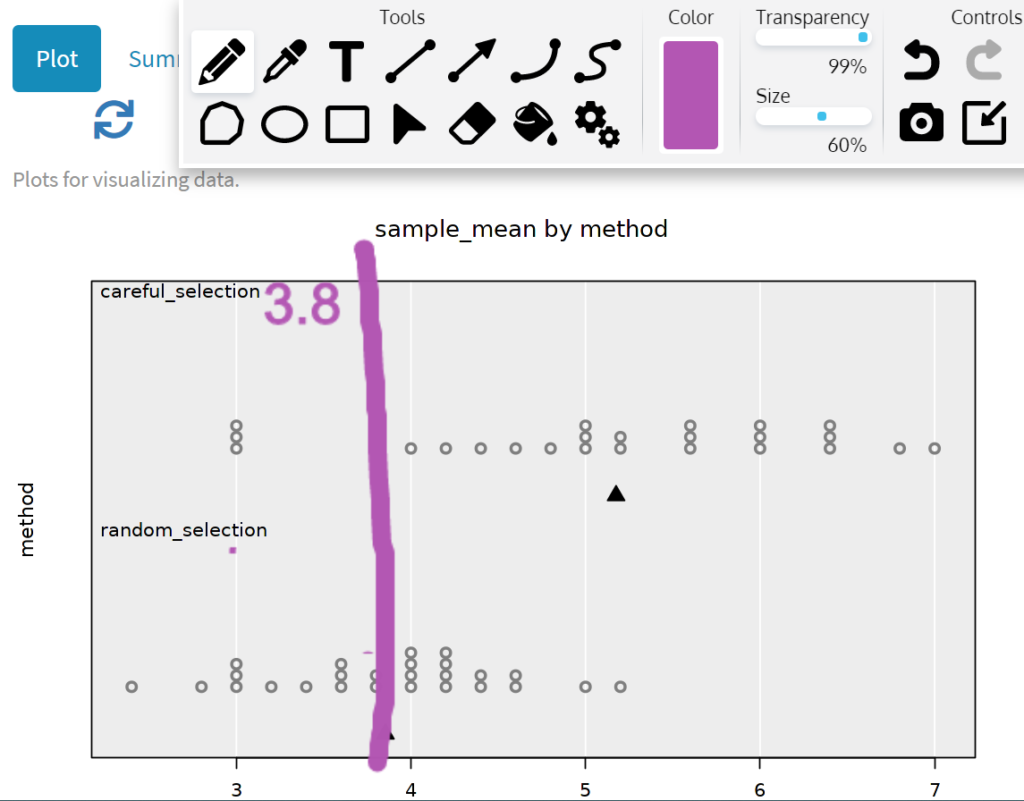
I do this by pre-publishing the Google sheet as a CSV, and creating a “data link” to iNZight Lite (see this video I made for the Auckland Maths Association about this process). Because I’m doing this live, after making a dot plot/box plot of the sample means, I use a Chrome extension called Web Paint to annotate the plot with the mean length of all the words in the lyrics (3.8 characters).

Round two is repeating the lyric sampling task, but using a random sampling method instead. To facilitate the process, I share a link with students to a very similar looking app, except this one does not allow you to choose your own words. Try it out below to select five words:
This new data (the sample means) gets added to the same Google sheet, and now we can compare the two methods.

I then ask students to write a short comment about what they have learned from the activity. Depending on the class/vibe, this can be done in the chat box (which will show their names if they participate), through another app which supports anonymous comments, or in breakout rooms for group-based discussion. After reviewing some of the comments to check what I intended to be the learning outcome actually happened, I have a couple of slides ready to summarise the key ideas (which pretty much just reference the course notes).
This “ZOOMifyed” example follows the same approach I would use in large face-to-face lectures:
- Students interact with an app that collects data in a Google sheet.
- The data is used straight away in the lecture, typically visualised using a web-based app (iNZight Lite a Shiny app).
- Students have to discuss and write something about what we’ve learned from the activity.
- I do some sort of “wrap up” of the key ideas, including filling in any gaps or clarifying any points that didn’t quite get covered in the comments/discussion.
If you want to do something similar, but don’t know how to create a Google sheet-based app (yet – check back here in a couple of weeks!), then you could try these alternative approaches:
- Show the lyrics on your slides, ask students to pick five words, count the letters, calculate the mean, and submit their sample mean through a Google form. Make sure to add a question asking for the sample mean (use validation to ensure it’s a number) and another question asking for the sampling method (e.g. careful selection vs random selection).
- You can then use the Google sheet attached to the Google form to visualise their sample means using the software tool of your choice. If you don’t want to publish the Google sheet as a CSV, you can download the sheet as a file type of your choice (e.g. CSV, XLSX etc.)
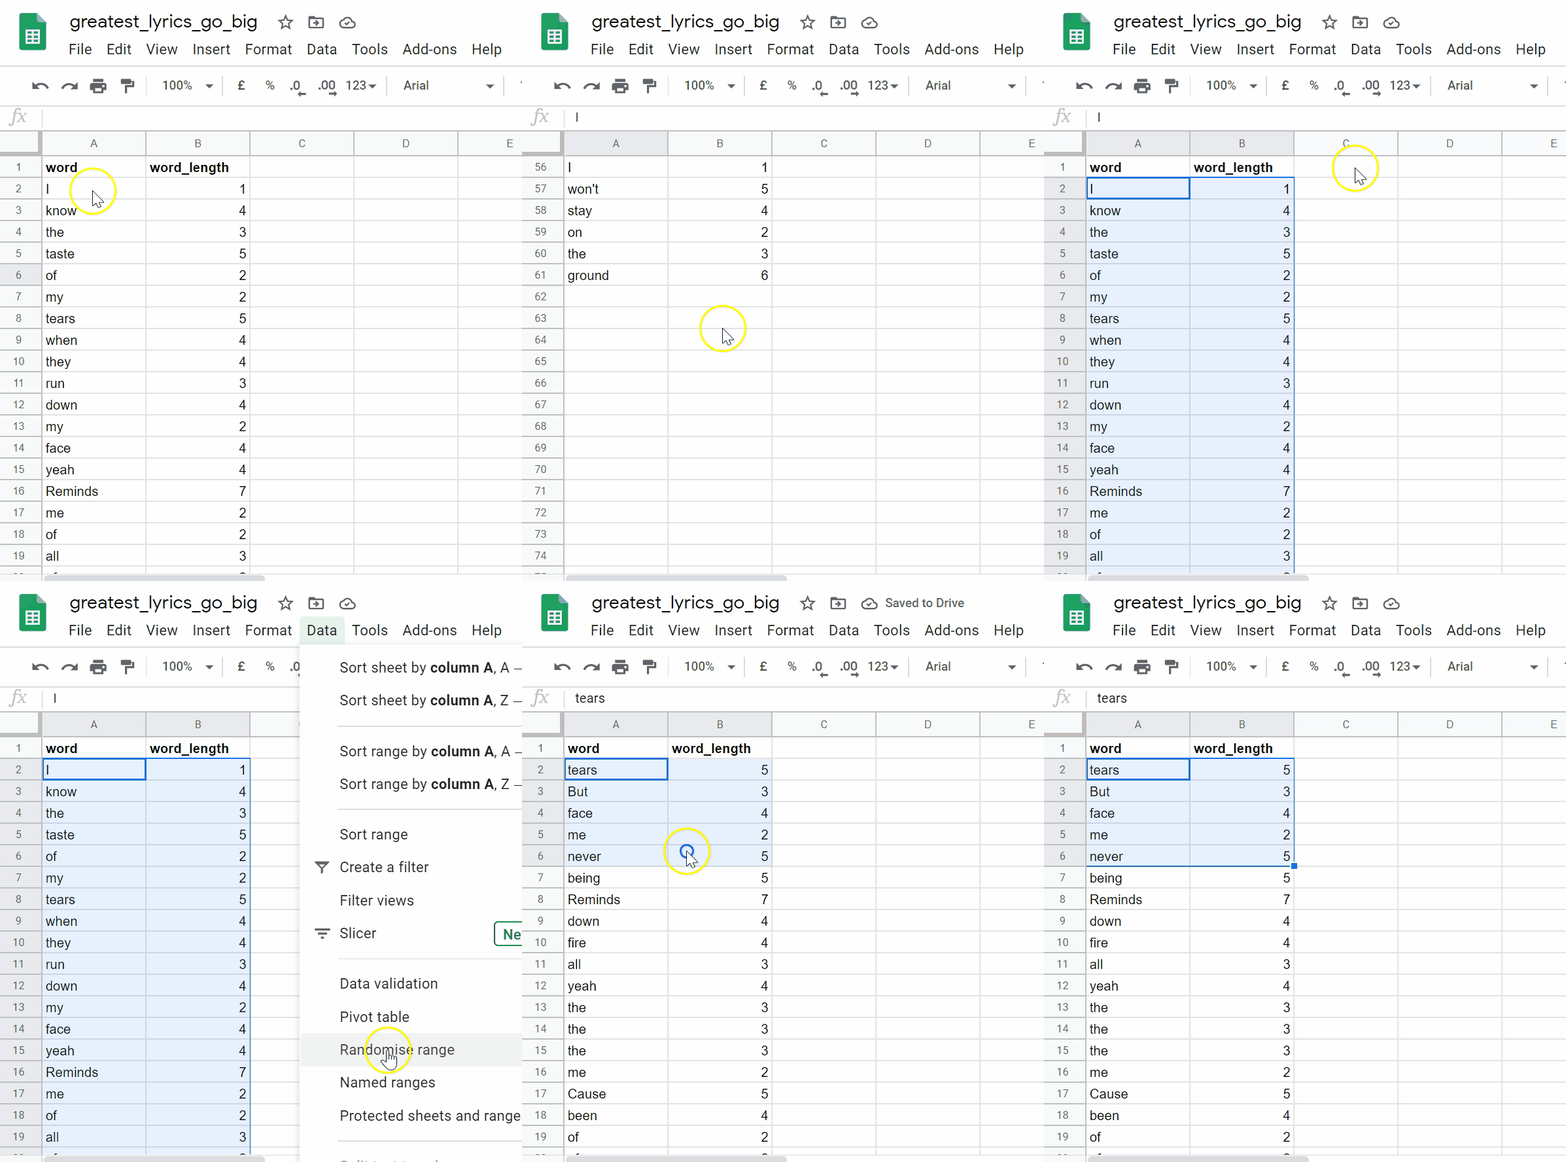
- For the random selection of five words, you could create and share a Google sheet for students to make their own copy of, that has each word on its own row in the sheet. Students can then highlight the words and use the Randomise range function from the Data menu to shuffle up the words, and use the first five in the shuffled list as their random sample.

Before “lockdown”, a question I was often asked by colleagues concerned about the amount of “on the fly” activities in my lectures was What about students watching the recorded lecture? I get the same question now, re-worded as What about students who can’t attend the “live lecture”? For both learning situations (face-to-face vs online), my students have told me that they enjoy the fact the lectures are so interactive, even when they watching a recording of the lecture. I think a key part to this is that as much as possible, all of the interactivity is captured on the recording and often there are live “whoopsies” or interesting discoveries/surprises. Even though a student who misses the lecture can’t take part in the “live” data collection activity, they seem to still appreciate the teaching approach of learning through doing.
Anna is a Lecturer in the Department of Statistics, University of Auckland.