Past experience has taught me that students struggle to reason using distributions and that this becomes a hurdle when learning the randomisation test. I use this activity at the start of my teaching for the randomisation test, however, it could equally well be used at the end or when teaching about P-values. I use it as dedicated teaching time to develop student understanding of distributions, what they show and how to reason with them. I use the simple context of height to give students an easy to understand access point to the activity.
The activity
First I show students an image of New Zealand Tall Ferns player, Esra McGoldrick (click on image in Twitter post to see full size):
I ask students to write down an estimate of how tall she is and also to write down if they think she is “unusually” tall or not. Estimating height from this image is purposefully difficult as there is not a lot in the image to use as a reference point to judge her height. Once students have made their estimates I share some of the responses with the class. We discuss how difficult it is to tell if she is unusually tall because there is no frame of reference.
I then ask: What do I mean by “unusual”? What would the criteria be for someone to be “unusually” tall? I take suggestions from students that often include answers like: “more than ____cm tall” or “has to stoop to go through a doorway” and then these develop onto answers such as “taller than most people” or “___cm taller than average height”.
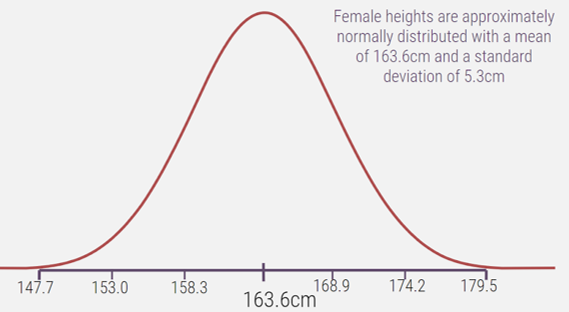
Once the idea of comparing Esra’s height to the height of other female New Zealanders has come up I show the following distribution:

We discuss what the distribution shows, where the average height is shown and how the standard deviation plays into the distribution. I also points out some of the basics, such as what the height of the distribution represents. Because my students tend to have a lot of experience with dotplots I ask them to think about the curve as sitting on top of all the dots of a dotplot.
Then I tell them that Esra is 188cm tall and show them where that sits on the distribution, which is way out in the right tail of the distribution. We discuss what this tells us and determine that she is much taller than most other female New Zealanders and that not many other females are as tall as (or taller than) 188cm. We determine that she is unusually tall.
But, it isn’t over yet! I point out to students that our frame of reference here was all female New Zealanders so we have worked out that Esra is unusually tall for a female New Zealander. But I then comment that Esra is a basketball player. Is she unusually tall for a basketball player?
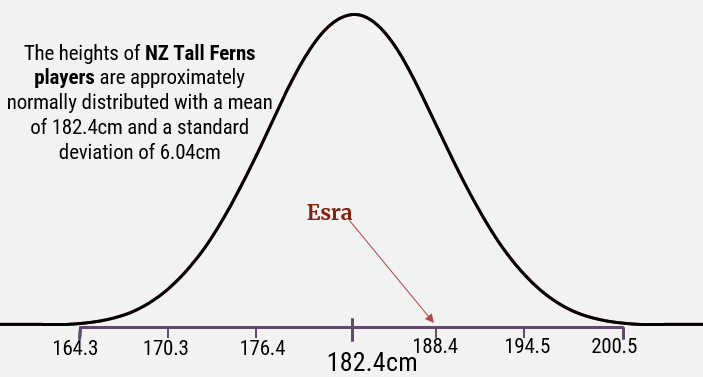
I show students the distribution of heights NZ Tall Ferns players and ask them to discuss. I then show where Esra’s height sits on this distribution and we determine that she is not unusually tall for a Tall Ferns player.

The key takeaway from this activity was: To determine if something is unusual or not we need some point of reference. If a value sits in the tail, then it’s unusual (for that distribution).

Emma is a Professional Teaching Fellow in the Department of Statistics, University of Auckland.